Risk and Financial Crises
The joke goes as follows.
Why do mathematicians believe everything is normally distributed? Because applied scientists say so. And why do applied scientists believe it? Because mathematicians proved it.
In the second lecture of his 2011 Financial Markets course, Yale professor and soon-to-be Nobel Laureate Robert Shiller teaches about the role of probability theory with concrete examples from the Global Financial Crisis (GFC) starting in 2007.
I watch it now in 2020 amidst a different, pandemic-driven economic crisis, but the lecture was no less topical at its original delivery that Spring semester. Months later, the Occupy Wall Street protests would begin.
Source
You can view the lecture along with me here:
Select Highlights
- Financial Crisis of 2007-2008 and Its Connection to Probability Theory
- Financial Return and Basic Statistical Concepts
- Independence and Failure of Independence as a Cause for Financial Crises
- Regression Analysis, Systematic vs. Idiosyncratic Risk
- Fat-Tailed Distributions and their Role during Financial Crises
Financial Crisis of 2007-2008 and Its Connection to Probability Theory
When we think of a crisis, we form narratives to help us understand.
For example, the 2007 Global Financial Crisis (GFC) began with bubbles in the stock, housing, and commodities markets. Exuberant investors drove prices high. We saw a pre-break in 2000, in the form of a world-wide stock market collapse, but it bounced back by 2003. Then in 2007, we saw widespread institutional collapse. We saw failure of companies investing in home mortgages. We saw bank failure in the U.S, bank runs in the U.K. Nations cooperated to manage the spread of the collapse, bailing out their banks and companies. The world averted unmitigated disaster, and the market began to recover.
But the financial theorist thinks about the crisis differently, not just in terms of a few big events, but as the accumulation of many smaller events. And though the stories are often helpful, they must look beyond to try and understand the underlying probabilities.
Financial Return and Basic Statistical Concepts
Return The most basic concept in finance is return, the sum of capital gains and dividends.
\[Return _t = \frac {Price _{t+1} - Price _t + Dividend _t} {P _t}\]The return is always within \([-1, ∞)\), because in a limited liability economy, you cannot lose more money than you put in. Therefore, as defined below, gross return is always non-negative.
\[Gross\,Return = 1 + Return\]Mean Return Now, suppose, in order to evaluate an investor’s success, you choose a measure of central tendency. You might take the arithmetic mean of their annual returns:
\[\bar{x} = \frac {1} {n} \sum_{i=1}^{n} {x _i}\]Alternatively, you may take the geometric mean, based on gross return (since negative factors could lead to imaginary returns):
\[G(x) = (\prod_{i=1}^{n} x_i)^{1/n}\]However, the geometric mean is a better measure of outcome. For example, suppose one year the simple return is 100%. This might weigh down the arithmetic mean, but the geometric mean falls to zero, which is probably a more accurate indicator of overall outcome. I.e. the geometric mean better captures the outsized impact of the calamity.
Covariance and Correlation Covariance describes the relatedness of two random variables.
\[cov(x,y) = \frac{1}{n} \sum_{i=1}^{n} (x-\bar{x})(y-\bar{y})\]Correlation normalizes that relationship onto a scale from \([-1, 1]\).
\[\rho = cov(x,y)/(s_x s_y)\]Independence and Failure of Independence as a Cause for Financial Crises
On Black Monday in 1987, global markets markets crashed. DJIA fell 22.6% in one day, and other major foreign markets saw declines as great as 40%. Afterward, companies started to compute a measure of risk: Value at Risk (VaR). E.g. a 5% VaR of $10M means there’s a 5% chance that the value will decline by $10M or more.
Companies world-wide were computing over-optimistic VaR figures, because of an assumption of independence in their portfolio. By the Law of Large Numbers, you might expect the performance of a portfolio to converge to the expected value as you accumulate more independent assets (e.g. individual mortgages). By bundling a large number of risky assets, you effectively create an intrument that’s more reliable, and therefore more valuable. But that reliability only holds if the assumption of independence also holds. As we saw in the GFC, the correlatedness of the mortgages’ performances snuck a lot of risk into these “safe” instruments.
In response to the GFC, Professor Brunnermeier of Princeton introduces the idea of a CoVaR, or correlated Value-at-Risk. The risk metric must recognize that, during some episodes, portfolios can co-vary more than expected.
Regression Analysis, Systematic vs. Idiosyncratic Risk
In this example, Shiller takes AAPL and the S&P 500 index, and he scatter plots their monthly returns.
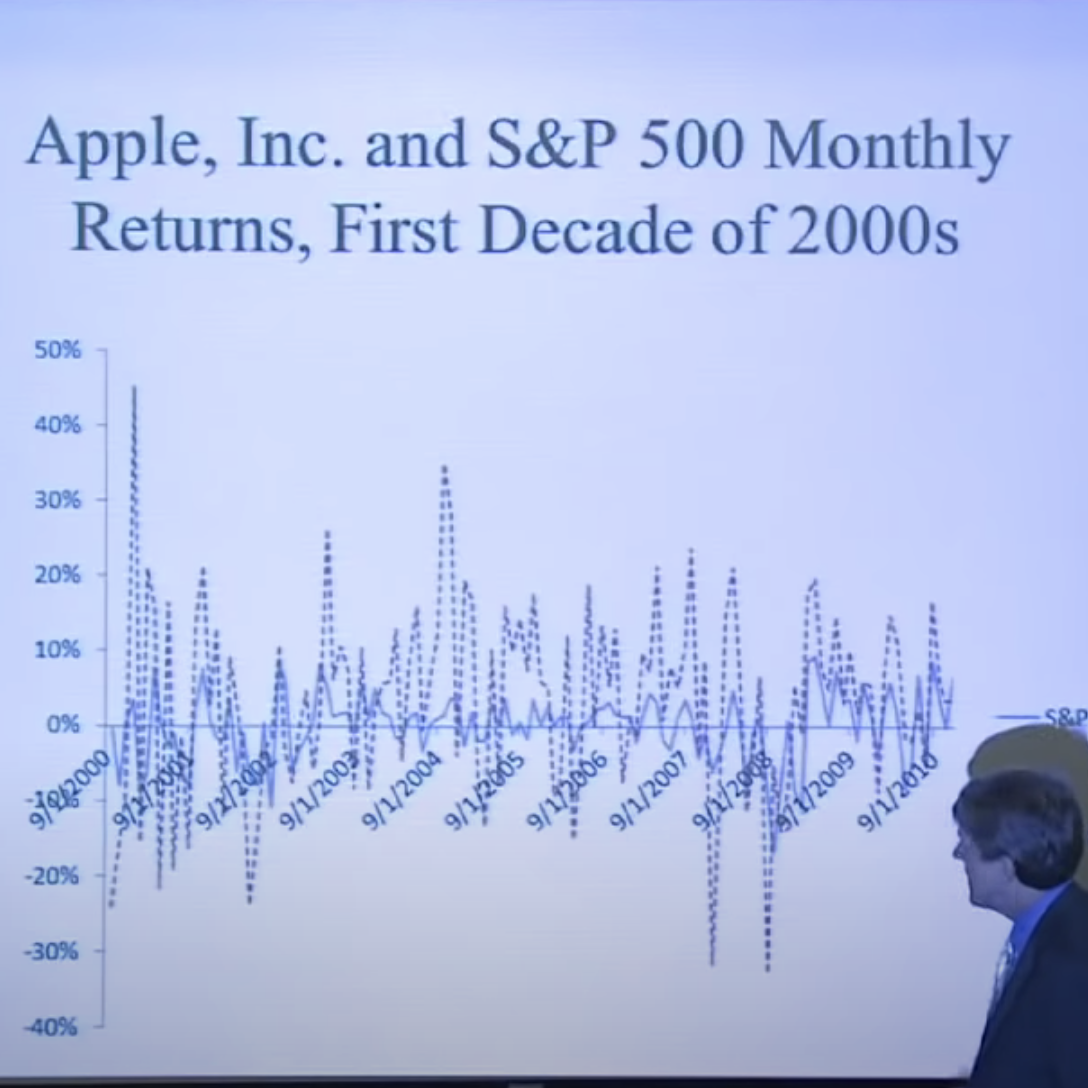
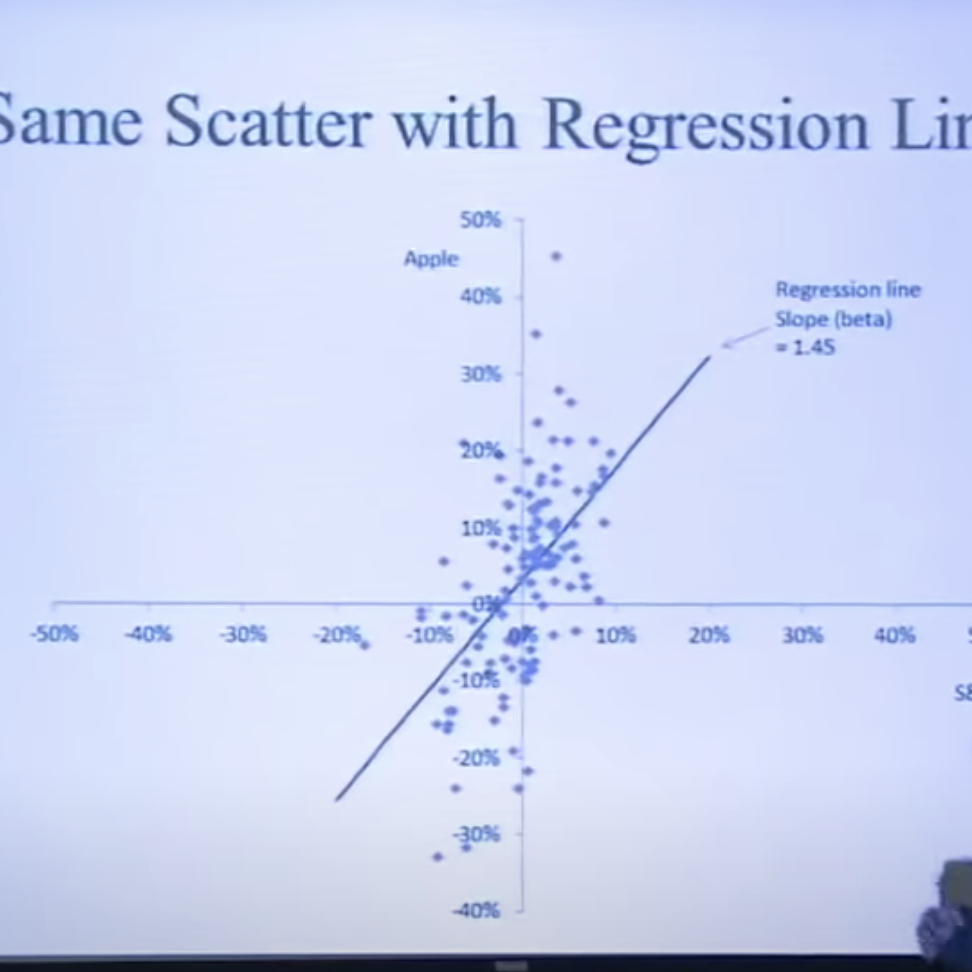
The linear regression line has a slope, called the beta which measures the stock’s volatility over the market. So we have the formula:
Fat-Tailed Distributions and their Role during Financial Crises
There’s a traditional assumption in finances, which turned out to be incorrect in the GFC: random shocks to the financial economy are normally distributed.
The Central Limit Theorem notes that, for independent identically distributed random variables with finite variance, a distribution of the average of these variables converges to the normal distribution. In other words, like so many things we observe in nature, averages are approximately normally distributed.
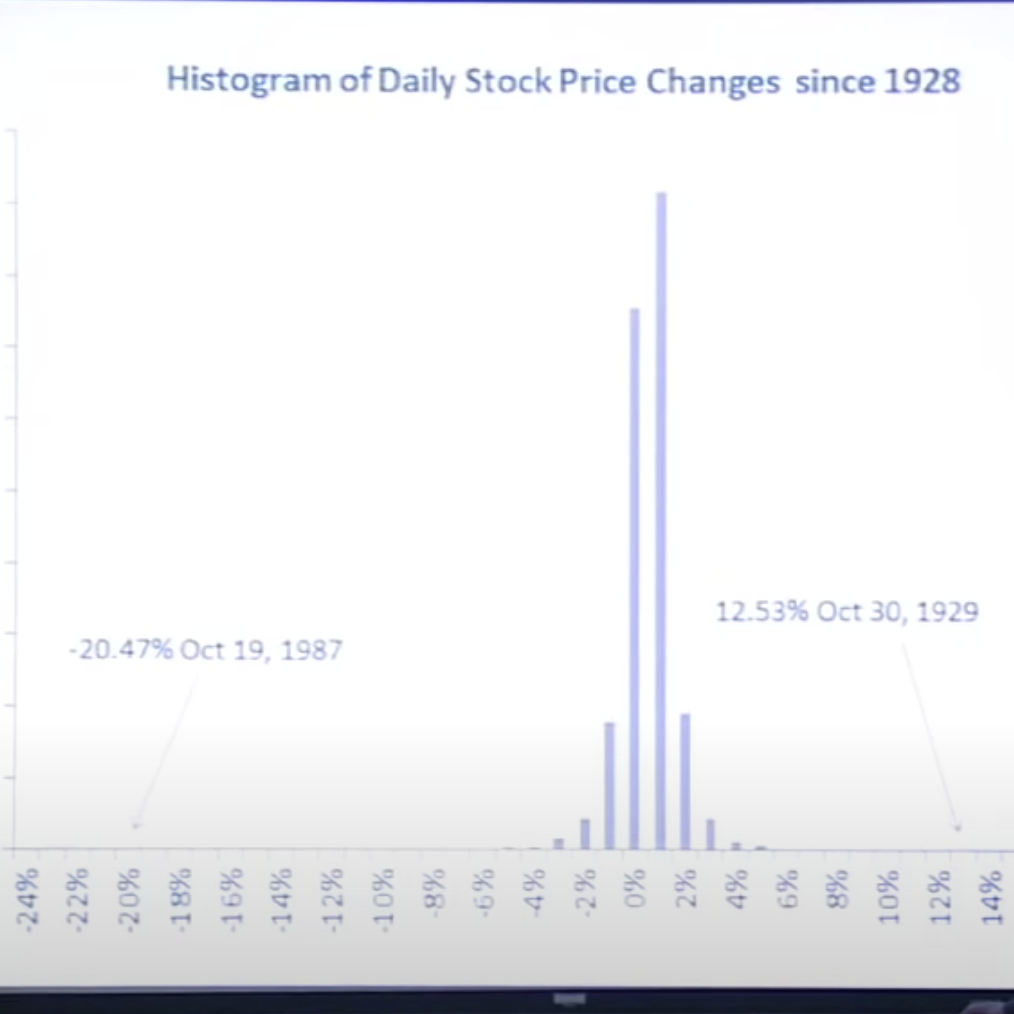
But the normal distribution does not have fat tails, and does not fit with the regular outliers we observe in finance. For example, the probability of Black Monday’s 20.5% drop should have a probability of \( 10^{-71} \) based on observations of daily swings, fitted to a normal distribution.
Independence leads to the law of large numbers, and a certain expectation of stability. But that expectation is only as good as its assumption of independence, and the financial crisis seems to be related to people’s failure to understand the limits of that assumption.